- Home
- News
- Spotlight on Science
- Static and dynamic...
Static and dynamic scattering with near-field speckles
08-04-2008
A team of scientists working at beamline BM05 at the ESRF has recently opened the way to a novel family of X-ray scattering techniques based on the statistical analysis of speckle images collected in the immediate vicinity (near field) of the scattering sample.
Many systems of interest for scattering studies are opaque to visible light and are increasingly being investigated with X-ray scattering techniques such as ultra small-angle X-ray scattering (USAXS) or X-ray photon correlation spectroscopy (XPCS). However, current X-ray scattering techniques cannot investigate the sample morphology and dynamics for spatial scales larger than about 1 µm. Filling this gap is very important for both fundamental and applied science.
A joint group of researchers from the University of Milan and the ESRF has made progress in this area, showing that it might be advantageous to abandon the usual idea of taking scattering measurements in the far field of the sample. In the new technique, the sample was illuminated with a rather large beam (1 mm2) and images of the speckle pattern formed immediately after the sample were collected with a CCD detector. The proximity of the detector to the sample guaranteed the coherent superposition of the stochastically-dephased scattered waves with the transmitted beam. Near-field speckle images were numerically Fourier transformed to produce results that are equivalent to far-field scattering experiments in which the Fourier transform takes place due to free space propagation. The team studied two kinds of samples: a microporous membrane and a colloidal suspension of silica nanoparticles in water.
 |
|
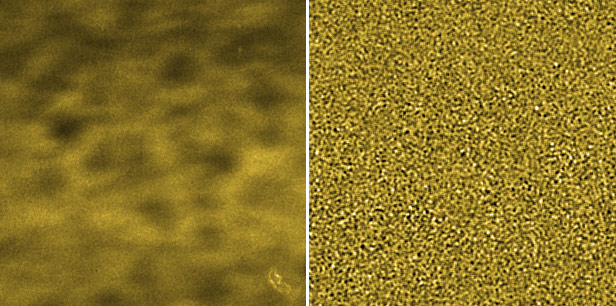
Figure 1: a) Speckle image recorded at 2.5 cm from the sample (colloidal dispersion of silica particles, diameter 500 nm). b) Image obtained by subtracting two images separated in time by a delay equal to 2 s. |
An image of a speckle field obtained with the silica nanoparticles is shown in Figure 1a. Although this image contains information about the sample, the information is superimposed on some large-scale stray noise, coming mainly from imperfections along the optical path such as the monochromator and the beryllium windows. This noise can be removed by analysing pairs of images grabbed at different times. Figure 1b is an example of this whereby the difference between images collected 2 seconds apart is reported. The remaining signal is solely the speckle pattern due to the Brownian motion of the particles. By analysing pairs of images at different time delays one can quantify the particle dynamics. Dynamic scattering results obtained with this method are reported in Figure 2 and compared with those obtained for larger wavevectors at ID10A with a far field XPCS technique. A similar comparison is reported in Figure 3 for static scattering data on the microporous membrane. In this case the near field speckle data are compared with USAXS data obtained at ID02.
 |
|
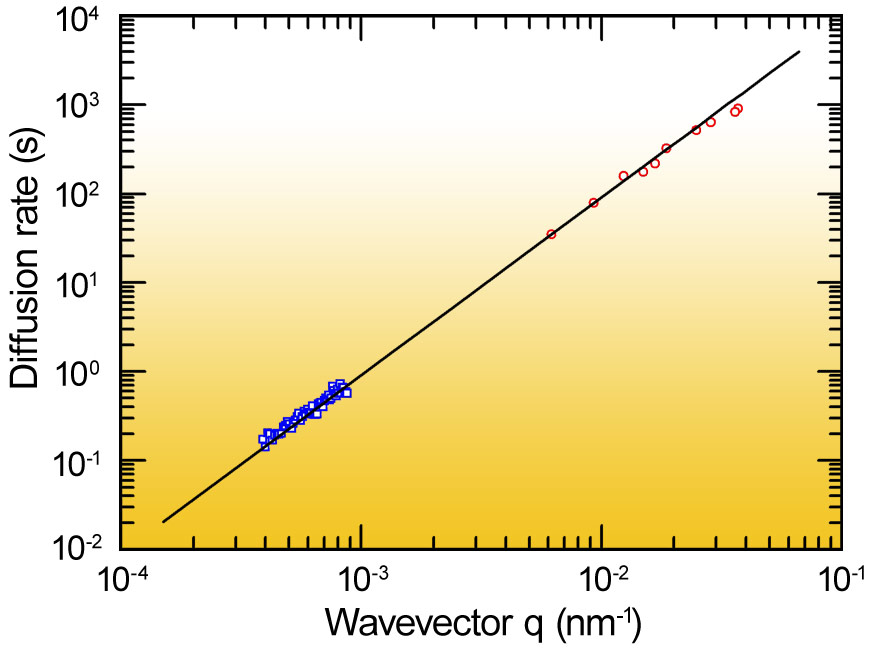
Figure 2: q-dependent diffusion rate Γ for silica particles in water. Blue open squares were obtained at BM05 with the near-field speckle analysis. Red open circles are results of a far-field XPCS measurement performed at ID10A. The black continuous line is the theoretical prediction Γ=Dq2 where D=9.1x10⁻¹³ m2/s is the mass diffusion coefficient of the particles. |
The results obtained suggest that near-field-speckle-based techniques might be a useful tool for the investigation of a large class of systems. Examples include aggregates and clusters of macromolecules, gels, emulsions, foams, vesicles, cells and the very broad class of systems that are classified as food colloids, which includes products such as yogurt and cheese.
 |
|
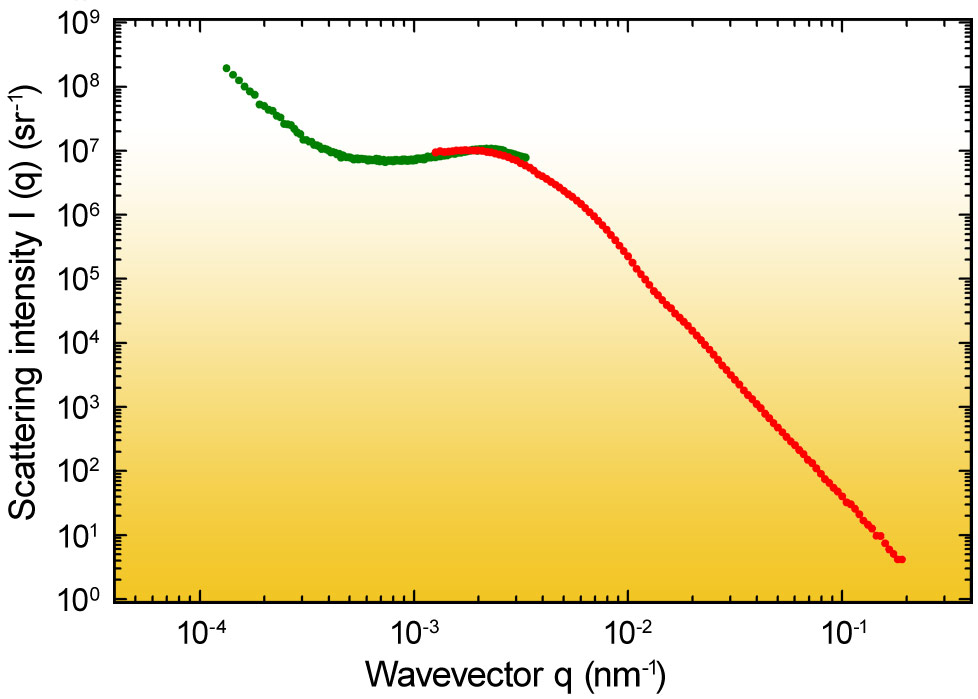
Figure 3: Absolute scattering intensity I(q) for a microporous membrane with nominal pore size 0.45 μm. The red curve (high q) corresponds to data obtained with an USAXS setup (Bonse-Hart camera, ID02). The green curve (low q) is obtained with the near field speckle method at BM05. |
Principle publication and authors
X-ray-scattering information obtained from near-field speckle, R. Cerbino (a,b), L. Peverini (c), M.A.C. Potenza (a), A. Robert (c,d), P. Bösecke (c) and M. Giglio (a), Nature Physics, doi:10.1038/nphys837.
(a) Department of Physics, Università degli Studi di Milano (Italy)
(b) Department of Chemistry, Biochemistry and Medical Biotechnologies, Università degli Studi di Milano (Italy)
(c) ESRF
(d) Stanford Linear Accelerator Center, CA (USA)
What's related?
partners


European Synchrotron Radiation Facility - 71, avenue des Martyrs, CS 40220, 38043 Grenoble Cedex 9, France.